
For self-insured employers
You fund the care.
Stop funding the waste.
Balto audits spending, challenges overcharges and finds better-priced care and medications for your employees and your plan.
Save as much as 20%* on your healthcare costs.

* Potential savings depend on your plan and the opportunities identified. Not a guaranteed or measured Balto employer result.
Where your money goes
The real reason you’re paying so much.
Inflated prices and avoidable charges flow into the bills your plan pays. Balto connects individual cases to spending patterns you can act on.
2027 employer health benefit costs, before cost-control changes.
Above estimated acquisition cost on 22% of specialty generics studied at Big 3 PBM-affiliated pharmacies.
Average hospital payments by employers and private insurers for the same services at the same facilities in 2022.
How the savings connect
When your employees spend less on healthcare, so do you.
When Balto lowers the price of care, the saving is shared the way the bill was. Your people keep more of their money and get time back. Your plan pays less for the same care.
An incorrect bill or code
A $12,000 bill, settled at $8,000
We challenge billing errors and negotiate directly with the healthcare facility. When employees are protected from overcharges, you are too.
What it costs per bill
40% of patients reported suspecting a billing error.
| Who pays | Without Balto | With Balto | Saved |
|---|---|---|---|
| Employee | $2,400 | $1,600 | $800 |
| Your plan | $9,600 | $6,400 | $3,200 |
| Total | $12,000 | $8,000 | $4,000 |
Example: GLP-1 program
A $1,200 prescription, now $449
We build custom employer-sponsored cash pay programs to replace overpriced plan medications like GLP-1s.
What it costs per member, per month
Exorbitant insurance fees often increase the costs by 3 to 10X, or more vs cash pay reimbursement rates.
| Who pays | Without Balto | With Balto | Saved |
|---|---|---|---|
| Employeecopay + meds | $65 | $0 | $65 |
| Employercopay + meds | $1,375 | $449 | $926 |
| Total | $1,440 | $449 | $991 |
About these illustrations. Shares assume 20% employee coinsurance after the deductible and before the out-of-pocket limit. All prices, payment splits and workforce volumes are hypothetical: they explain how savings could be shared and are not results from our patient stories or measured employer outcomes. Actual impact depends on allowed amounts, coverage, cost sharing, rebates, stop-loss, fees and payment responsibility. These examples do not establish the 15% savings target.
What Balto adds
We connect employee care to employer savings.
Our medical team challenges denials, reviews bills and finds lower-cost care. We use what we uncover to identify spending problems across your plan and pursue savings with your existing partners.

- Broker / consultantDocumented findings and support in vendor negotiations.
- TPA / PBM / claims auditorIndependent cost review, corrections and recovery follow-through.
- Care navigation / member supportMedical evidence for complex appeals and missed savings.
Employees get private support. You see the overall results.Employer reports exclude clinical records and private case conversations.
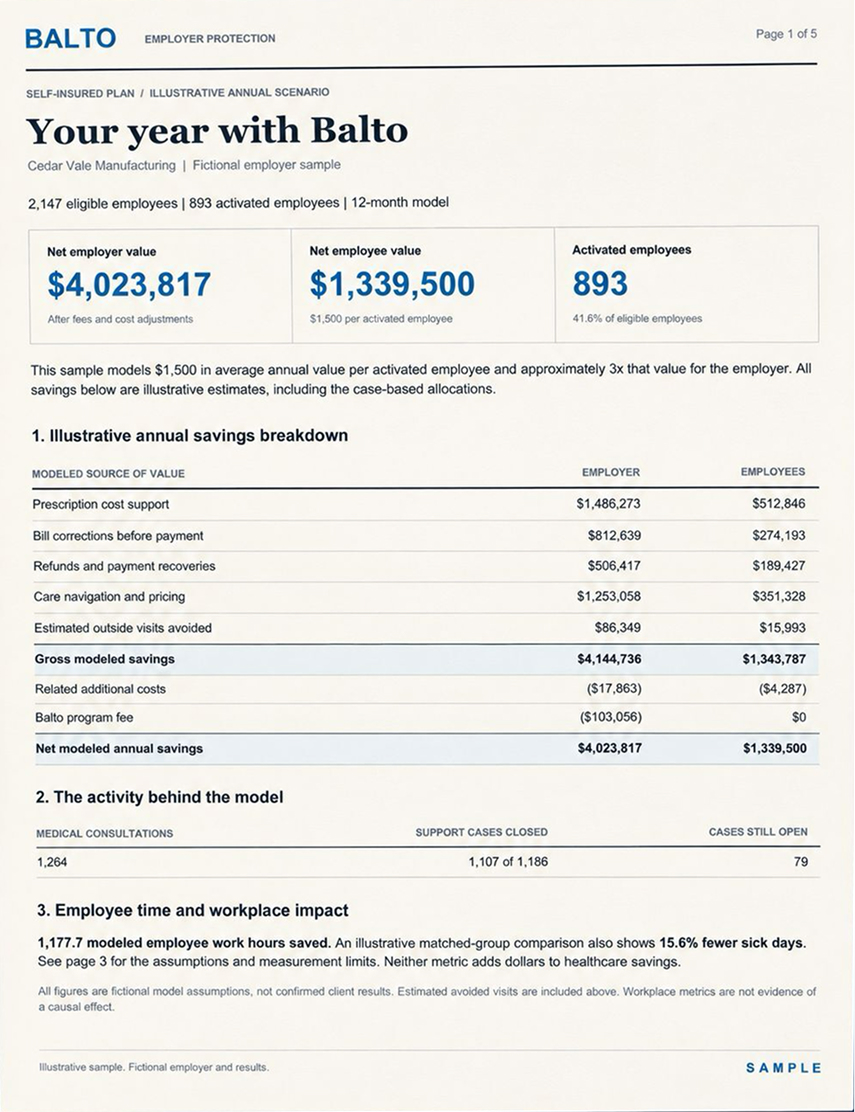
What your savings report will show
See where your money went.
And what we can do about it.
We pursue savings throughout the year. Your report documents what changed, what was recovered and where to look next.
- Money recoveredConfirmed refunds and corrected payments, with fees and adjustments accounted for
- Costs reducedVerified plan and employee savings from casework, shown separately from money recovered
- Opportunities to pursueEstimated value, recommended actions and status, kept separate from confirmed results
Confirmed savings and future opportunities are reported separately. Analysis reflects the claims, pricing and plan data available.
Getting started
Start with your biggest costs.
Leave with a proposed first savings opportunity, the data needed to assess it and clear next steps. Bring reports if you have them; no preparation is required.